Basic Azure Application Gateway Monitoring
with pre-built Azure Monitor Log queries!
I am a sysadmin who focuses on the Windows ecosystem (with a spattering of Linux ). I have a passion for the cloud, scripting and solving problems that engineers like me face daily.
What is Azure Application Gateway
Azure Application Gateway is a Layer-7 Load Balancer. For a brief overview of the OSI Model and where Layer-7 fits, check out this fantastic Cloudflare Article.
In short, Azure Application Gateway is used to load balance HTTP/HTTPS traffic to a back-end pool of resources.
Azure Monitor and Log Analytics
Azure Monitor is a "one-stop-shop" for ingesting logs and running queries on logs for the Azure Application Gateway and other Azure resources. Utilizing this tool is the primary method to gain insight on what is happening inside of your load balancer at any given time.
Azure Monitor links up with Azure Log Analytics and Log Analytics Workspaces.
These workspaces are where the logs are sent, and the Log Analytics Kusto language is used to query the logs.
Kusto Language
The meat and potatoes of our logs is to work with the Kusto Language. Check out how to use the Kusto Language at this documentation link.
For the rest of this guide, we'll assume you have a service that exposes HTTP/HTTPS traffic.
Setting up the logs
You will need an active Azure Application Gateway already created for this. This article will not cover this process. You can check out how to do this here.
Creating a Log Analytics Workspace
Navigate to the Resource Group you need.
Create a new Log Analytics Workspace in the region you need.
Once the Workspace is created you are ready to move on.
Sending logs to the Log Analytics Workspace
Once the Application Gateway is created, navigate to the Application Gateway resource in the region you need (same as the Log Analytics workspace!)
Navigate to Monitoring -> Diagnostic Settings -> Add Diagnostic Setting
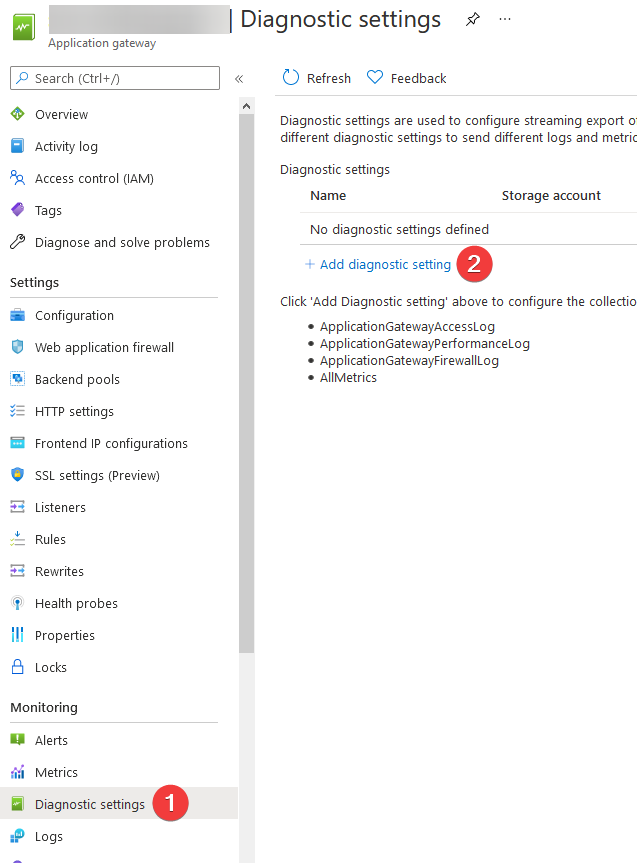
Select the appropriate log category. Below is a list of categories and their function:
ApplicationGatewayAccessLog - Access requests (such as GET requests)
ApplicationGatewayPerformanceLog - Performance data (such as latency)
ApplicationGatewayFirewallLog - Firewall logs, if you have enabled the Web Application Firewall (WAF) option
Select the Log Analytics workspace we created earlier as the destination.
Send some data to your web application, put some load on it and allow some time for Log Analytics to ingest your data.
Accessing the Logs and running queries
After some time ingesting data, you should be ready to query those logs!
Navigate to the Application Gateway resource.
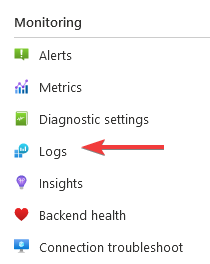
On the resource, to the left scroll to Monitoring and select Logs.
Select Get Started.
By default, the Queries screen appears. Some basic example queries are listed. Close the window, and you are now ready to use the Kusto query language.
On to the queries!
Here's a list of the queries I've found useful and their associated task:
| Query Description | Query | ||
| Query requests per Minute by URI, displayed in a timechart | AzureDiagnostics| where ResourceProvider == "MICROSOFT.NETWORK" and Category == "ApplicationGatewayAccessLog" | summarize count() by requestUri_s, bin(TimeGenerated, 1m) | render timechart | ||
| Total Requests by URI | AzureDiagnostics | where ResourceProvider == "MICROSOFT.NETWORK" and Category == "ApplicationGatewayAccessLog" | summarize count() by requestUri_s | ||
| Number of URIs by Client IP with Query Strings | AzureDiagnostics | where ResourceProvider == "MICROSOFT.NETWORK" and Category == "ApplicationGatewayAccessLog" | summarize count() by requestUri_s,clientIP_s,requestQuery_s | ||
| HTTP Error count per hour by URI with error code greater than or equal to 500 | AzureDiagnostics | where ResourceProvider == "MICROSOFT.NETWORK" and Category == "ApplicationGatewayAccessLog" | where httpStatus_d >= 500 | summarize count(httpStatus_d) by httpStatus_d,requestUri_s, bin(TimeGenerated, 1h) | order by count_httpStatus_d desc | project httpStatus_d, requestUri_s, TimeGenerated, count_httpStatus_d | ||
| HTTP 502 errors by backend VM rendered as a timechart | AzureDiagnostics | where ResourceProvider == "MICROSOFT.NETWORK" and Category == "ApplicationGatewayAccessLog" | where httpStatus_d == 502 | parse requestQuery_s with "SERVER-ROUTED=" serverRouted "&" | extend httpStatus = tostring(httpStatus_d) | summarize count() by serverRouted, bin(TimeGenerated, 5m) | render timechart | ||
| Failed requests by backend VM, by status code, rendered as a timechart | AzureDiagnostics | where ResourceProvider == "MICROSOFT.NETWORK" and Category == "ApplicationGatewayAccessLog" | where httpStatus_d >= 400 | parse requestQuery_s with "SERVER-ROUTED=" serverRouted "&" | extend httpStatus = tostring(httpStatus_d) | summarize count() by serverRouted, bin(TimeGenerated, 5m) | render timechart | ||
| Failed requests by 500 status code | AzureDiagnostics | where ResourceProvider == "MICROSOFT.NETWORK" and Category == "ApplicationGatewayAccessLog" | where httpStatus_d == 500 | summarize count() by requestUri_s,httpStatus_d | ||
| Sum of total error counts | AzureDiagnostics | where ResourceProvider == "MICROSOFT.NETWORK" and Category == "ApplicationGatewayAccessLog" | where httpStatus_d >= 400 | summarize count() by httpStatus_d, Resource | ||
| Count total URI Hits in a 24-hour period | AzureDiagnostics | where ResourceProvider == "MICROSOFT.NETWORK" and Category == "ApplicationGatewayAccessLog" | summarize count(requestUri_s) by httpStatus_d,requestUri_s, bin(TimeGenerated, 24h) | order by count_requestUri_s desc | project httpStatus_d, requestUri_s, TimeGenerated, count_requestUri_s | ||
| Average latency every hour (Performance of Application Gateway), rendered as a timechart | AzureDiagnostics | where ResourceProvider == "MICROSOFT.NETWORK" and Category == "ApplicationGatewayPerformanceLog" | summarize avg(latency_d) by Resource, bin(TimeGenerated, 1h) | render timechart | ||
| Number of Unique IP's by URI | AzureDiagnostics | where ResourceProvider == "MICROSOFT.NETWORK" and Category == "ApplicationGatewayAccessLog" | where requestUri_s == "/enter/uri/here.aspx" | summarize count() by clientIP_s | ||
| Display hits by URI | AzureDiagnostics | where ResourceProvider == "MICROSOFT.NETWORK" and Category == "ApplicationGatewayAccessLog" | where requestUri_s contains "/enter/uri/here.aspx" | summarize count() by requestUri_s, bin(TimeGenerated, 24h),clientIP_s,requestQuery_s |